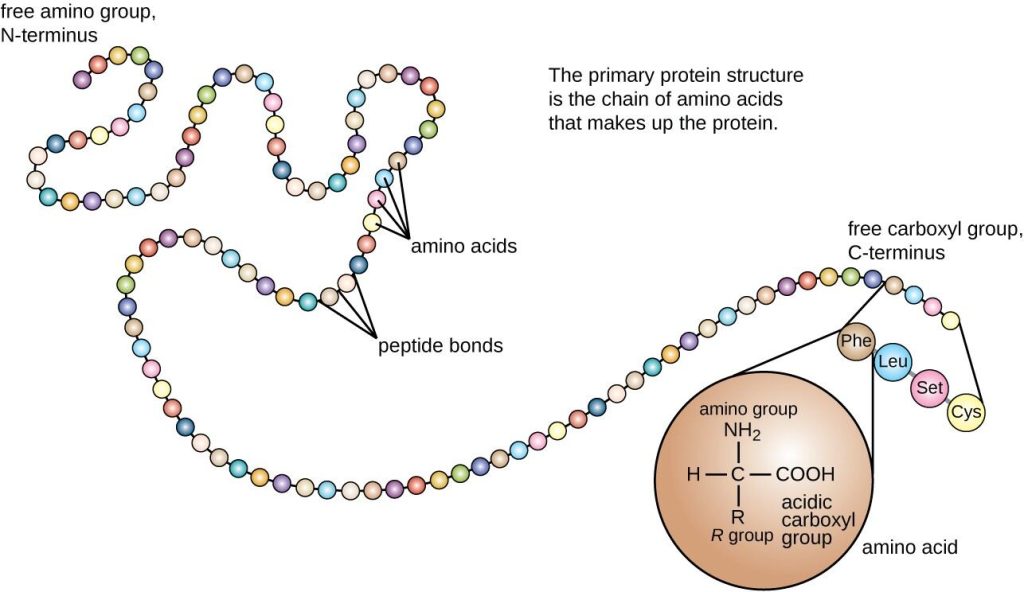
The primary structure of a protein is defined as the sequence of amino acids of which it is composed. This sequence ultimately determines the shape that the protein adopts, according to the spatial limitations on the arrangement of the atoms in the protein, the chemical properties of the component amino acid residues, and the protein’s environment.
The peptide bonds that link amino acid residues in a polypeptide are formed in a condensation reaction between the acidic carboxyl group of one amino acid and the basic amino group of another amino acid. In the context of a peptide, the amide group (CO–NH) is referred to as the peptide group.
Crucial to an understanding of protein structure is a knowledge of the structure of the peptide bond. Linus Pauling, in the 1930s, used X-ray diffraction to examine the nature of the peptide bond formed between two amino acids. He reported that the peptide group (CO–NH) has a rigid planar structure. This structure is due to interactions between electrons of the double bond of the carbonyl group and those of the C–N bond (Figure 2) such that the latter acquires partial (about 40%) double-bond properties.
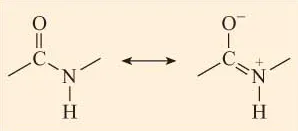
Figure 2 Resonance interactions between electrons in the C=O bond and the C–N bond of the peptide group mean that there is ‘sharing’ of electrons between these bonds. Note the charges on the N and O atoms.
This effect is an example of resonance which can be thought of as a sharing of electrons between bonds. Since single bonds between two atoms are longer than double bonds between the same two atoms, the lengths of the C–N and C=O bonds in the peptide group differ from those observed for these bonds in other contexts where resonance does not occur. Thus the partial double bond character of C–N in the peptide group means that this bond is shorter than would be predicted for a C–N single bond, whilst the C=O bond, having a partial single bond character due to resonance, is longer than would be predicted for a C=O double bond. The bond lengths in the peptide group are indicated in Figure 3. Compare the C–N bond of the peptide group with that between N and Cα (the C atom to which the amino group and carboxyl group are attached).

View larger image
Figure 3 The average dimensions in angstroms, Å (10 Å = 1 nm = 1000 pm), and degrees, of the planar peptide group in (a) the trans conformation and (b) the cis conformation. Note: in this and other representations of the configuration of polypeptides, there is no indication of bond order (i.e. single or double bonds).
There are two possible conformations of the planar peptide bond: in the trans peptide group, the Cα atoms are on opposite sides of the peptide bond (Figure 3a) and in the cis peptide group, the Cα atoms are on the same side of the peptide bond (Figure 3b).
· Considering the spatial arrangement and the proximity of the atoms in the cis and trans conformations of the peptide bond, which conformation do you think would be favoured?
Reveal answer
Generally speaking, peptide bonds are in the trans conformation. However, cis forms can occur in peptide bonds that precede a proline residue. In such cases, the cis form is more stable than usual since the proline side-chain offers less of a hindrance. Nonetheless, cis peptide bonds occur only in approximately 10% of instances of peptide bonds preceding proline residues.
Bearing in mind the planar nature of the peptide group, a polypeptide chain can be seen to have a backbone that consists of a series of rigid planar peptide groups linked by the Cα atoms. Figure 4 shows part of a polypeptide with two planar peptide groups in the trans conformation. Note that though rotation is not permitted about the peptide bonds, there is potential for rotation around the Cα–N and Cα–C bonds. The angles of rotation, termed torsion angles , about these bonds specify the conformation of a polypeptide backbone. The torsion angles about the Cα–N and Cα–C bonds are referred to as ɸ (phi) and ψ. (psi), respectively and they are defined as 180° when the polypeptide is in the extended planar conformation, as illustrated in Figure 4.

Figure 4 A portion of a polypeptide showing two planar peptide groups (shaded areas) joined at the Cα atom. There is little freedom of movement within the peptide group, but rotation of the peptide groups about the Cα–N and Cα–C bonds can occur and is defined by the torsion angles φ and ψ respectively. In the extended conformation shown here, both these angles are defined as 180º. By convention, φ and φ increase with clockwise rotation of the peptide group when viewed from Cα, as indicated by the arrows.
You will not be surprised to learn that steric constraints apply to ɸ and ψ.
As a result of these steric constraints, only certain values of ɸ and ψ, and hence conformations of the peptide, are permitted whilst others are not.
It is possible to calculate these permitted values for a given residue in the context of a polypeptide. This calculation is performed by first determining the distances between all the non-bonding atoms in two neighbouring peptide groups (such as those in Figure 4) at all the possible values of ɸ and ψ. It is most readily done for a polypeptide containing just one kind of amino acid. A conformational plot of ɸ against ψ for a particular residue is known as a Ramachandran plot (after its inventor, G. N. Ramachandran). Such a plot allows us to identify those conformations (i.e. for a particular value of ɸ and ψ) that are sterically favourable or unfavourable (as in Figure 5), according to the following criteria:
· Where there is no conflict between the van der Waals radii of non-bonding atoms, a conformation is ‘allowed’. These conformations lie in the blue areas in Figure 5.
· Conformations requiring interatomic distances at the limit of that which is permissible are defined as ‘outer limit’ conformations. They lie in the green areas in Figure 5.
· Theoretical conformations that require any two non-bonding atoms to be closer to each other than their van der Waals radii allow are sterically ‘forbidden’. These lie in the white areas in Figure 5.
Notice that the values of ɸ and ψ in Figure 5 range from −180º to +180º. Turning the peptide group through 360º will of course bring it back to its starting position, and −180º and +180º correspond to the same position. Thus the green strip at the bottom left corner of the plot in Figure 5 is contiguous with the field at the top left corner.

Figure 5 A Ramachandran plot showing the sterically allowed ɸ and ψ angles for a peptide chain containing only L-alanine residues (poly-L-alanine). ‘Allowed’ conformations are within the blue or green areas, with those that are ‘outer limit’ conformations in the latter. The remaining conformations, in the white area, are ‘forbidden’. Note that there are only three discrete regions (numbered 1–3) corresponding to allowed conformations. (Data from Ramachandran and Sasisekharan, 1968).
· Use Figure 5 to determine whether the following values of ɸ and ψ are sterically favourable or unfavourable: (a) ɸ = 90º and ψ = 90º; (b) ɸ = −90º and ψ = 90º.
Reveal answer
Ramachandran plots can be constructed for polymers of each of the 20 amino acids. It is significant to note that the Ramachandran plots for many amino acid residues are generally very similar, having only three regions with favourable or tolerated conformations (labelled 1–3 in the plot for poly-L-alanine in Figure 5). Differences do occur, however. For instance, where the side-chain (R in Figure 4) is branched near Cα, as in the case of threonine, it occupies more space close to the peptide backbone and restricts the approach of atoms in the neighbouring peptide groups. As a result, allowed conformations (ɸ and ψ angles) are more restricted for polypeptides of branched amino acids.
· Proline is also quite different from other amino acids in terms of allowed conformations and for polyproline only ɸ values from −85º to −35º are tolerated. Thinking about the structure of proline, how can you explain this relatively narrow range of permitted ɸ values?
Reveal answer
· Figure 6 shows the Ramachandran plot for glycine residues in a polypeptide chain. The regions are colour-coded as in Figure 5. What can you say about the conformations that glycine adopts? Consider the structure of glycine. Why does glycine differ from the other residues with respect to its conformations?
Reveal answer
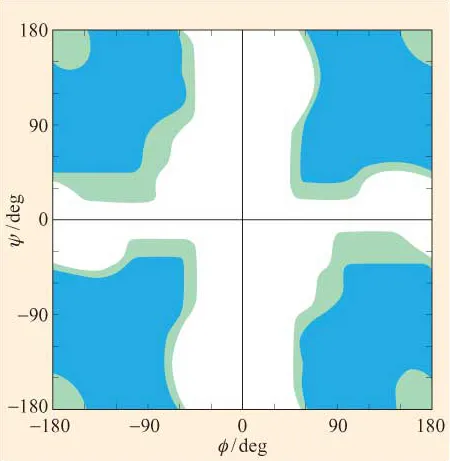
Figure 6 A Ramachandran plot for poly-L-glycine. Regions of ‘allowed’, ‘outer limit’ and ‘forbidden’ conformations are coloured as in Figure 5. (Data from Ramachandran and Sasisekharan, 1968)
The Ramachandran plots in Figures 5 and 6 have been generated for, respectively, L-alanine and L-glycine on the basis of allowed and outer limit distances for interatomic contacts, determined from known values for van der Waals radii of the atoms (Table 1).
Table 1 Van der Waals distances for interatomic contacts.
| Contact type | Normally allowed / Å | Outer limit / Å |
| H···H | 2.0 | 1.9 |
| H···O | 2.4 | 2.2 |
| H···N | 2.4 | 2.2 |
| H···C | 2.4 | 2.2 |
| O···O | 2.7 | 2.6 |
| O···N | 2.7 | 2.6 |
| O···C | 2.8 | 2.7 |
| N···N | 2.7 | 2.6 |
| N···C | 2.9 | 2.8 |
| C···C | 3.0 | 2.9 |
| C···CH2 | 3.2 | 3.0 |
| CH2···CH2 | 3.2 | 3.0 |
They are therefore predictive rather than actual conformational plots. We can, of course, use X-ray diffraction to determine experimentally the ‘real’ values of ɸ and ψ for residues in a polypeptide. In Figure 7, the ɸ and ψ values for all the residues (with the exception of glycine and proline) in a number of different structures have been determined by high-resolution X-ray diffraction and plotted on a Ramachandran plot. We can see that there is a striking correspondence between predicted and actual conformations. Notice, however, that there are some residues whose conformations map to the ‘forbidden’ areas. Most of these residues map in the region between ‘allowed’ regions 2 and 3, around ψ = 0.
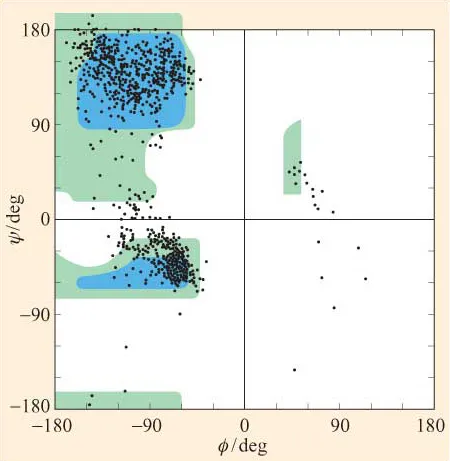
Figure 7 Based on X-ray diffraction data for a number of polypeptide structures, the ɸ and ψ values for all amino acid residues (with the exception of glycine and proline) have been superimposed on a predicted Ramachandran plot of ‘allowed’ and ‘outer limit’ conformations. Predictions were based on van der Waals distances for interatomic contacts as described in the text. Notice that the majority of actual values correspond to predicted permissible conformations.
· Look again at Figure 4 and imagine that you can twist the topmost peptide group through 180° so that ψ = 0. What groups are likely to conflict in this conformation?
Reveal answer
The conflict associated with these conformations can be accommodated by a small degree of twisting of the peptide bond. Thus, in such conformations the peptide group is twisted out of its usual planar conformation.
A limited number of ‘forbidden’ conformations of particular residues can be tolerated in a polypeptide if the adopted conformation, as a whole, is energetically favourable. A polypeptide will tend to fold such that it adopts the most stable conformation. In this conformation, the polypeptide minimises its free energy. In the next sections, we shall look at this higher level of protein structure.